| StockFetcher Forums · Stock Picks and Trading · Generic2 | << 1 ... 3 4 5 6 7 ... 9 >>Post Follow-up |
| four 5,087 posts msg #132995 - Remove message |
12/1/2016 9:11:58 PM |
| klynn55 747 posts msg #133005 - Remove message |
12/2/2016 1:19:36 PM four, a little help, you use a sto 40,1,1, I have it set up on thinkorswim to chart as full sto, k , 40 d,1 , is that correct, it sure seems to give good signals when the price pierces the 20 ma and the sto has come up from 20. I guess whether it's correct or not doesn't matter cause it works but just interested. thanks for all your hard work! good holidays to you ! |
| four 5,087 posts msg #133016 - Remove message modified |
12/2/2016 6:40:50 PM @klynn, thank you for visiting and happy holidays. You reference: four 3,378 posts msg #132869 modified 11/29/2016 12:17:08 AM ----------------------------------------------------------------------------------- You may use any of the three (picture below) since I do not use the smoothing value. See the same result occurs... /* /* Full Stochastic */ set{fs, Stochastic %K(40,1,1)} draw fs line at 20 /* Stochastic */ set{s, Stochastic %K(40,1)} draw s line at 20 /* Williams */ set{w, williams %R(40)} draw w line at -80 */ 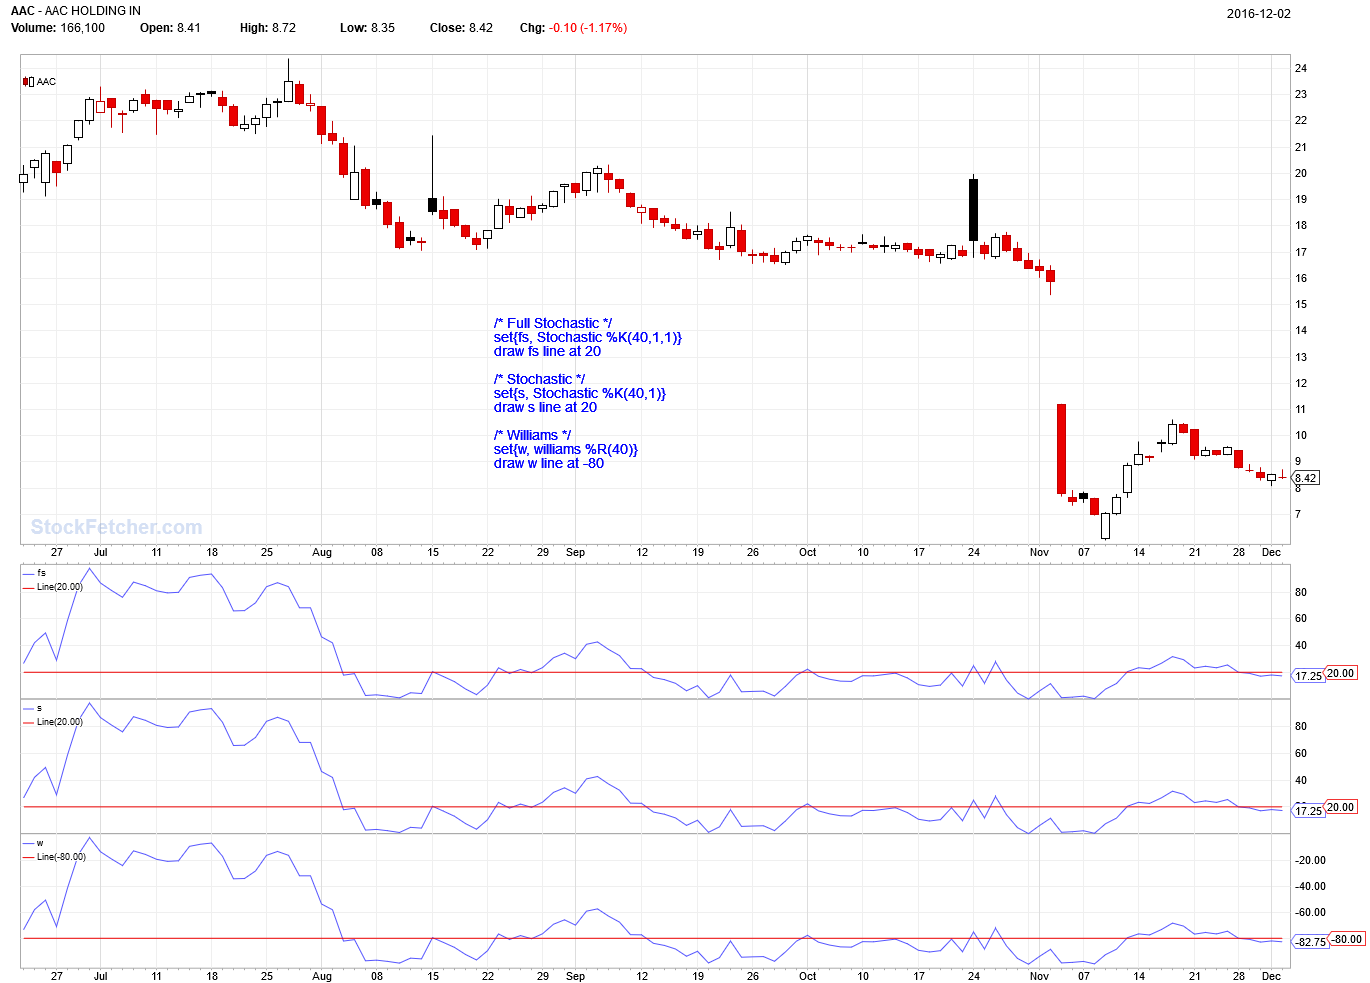 ------------------------------------------- |
| four 5,087 posts msg #133018 - Remove message |
12/2/2016 7:31:49 PM  |
| four 5,087 posts msg #133033 - Remove message modified |
12/3/2016 8:11:19 PM |
| tugga82 12 posts msg #133057 - Remove message |
12/5/2016 12:41:00 PM Four, Am relatively new to trading and you seem to be a wealth of knowledge when it comes to trading and coming up with a variety of filters. I also came across this below code from your read only post earlier and was wondering if you can walk me through the logic and how to trade the set up from below. Anything you can do to help will be appreciated. Cheers, Tugga /* Extreme Finder 1.0 */ sp900 low > 1 and volume > 123123 and close < lower Bollinger band(40,0.4) and draw ppo(1,20) < -.10 and ppo(1,5) > ppo(1,5) 1 day ago draw ppo(1,5) 1 day ago < -.05 draw ppo(1,5) line at -.05 draw ppo(1,20) line at -.10 add column annual dividend yield ] |
| four 5,087 posts msg #133376 - Remove message modified |
12/24/2016 8:16:12 AM Text book launch and climb... rsi(5) never came back to 30 ... never had a candle low below the trigger ... new entry Nov 3 [rsi9 dips below 50 when cmo55 is over 20] 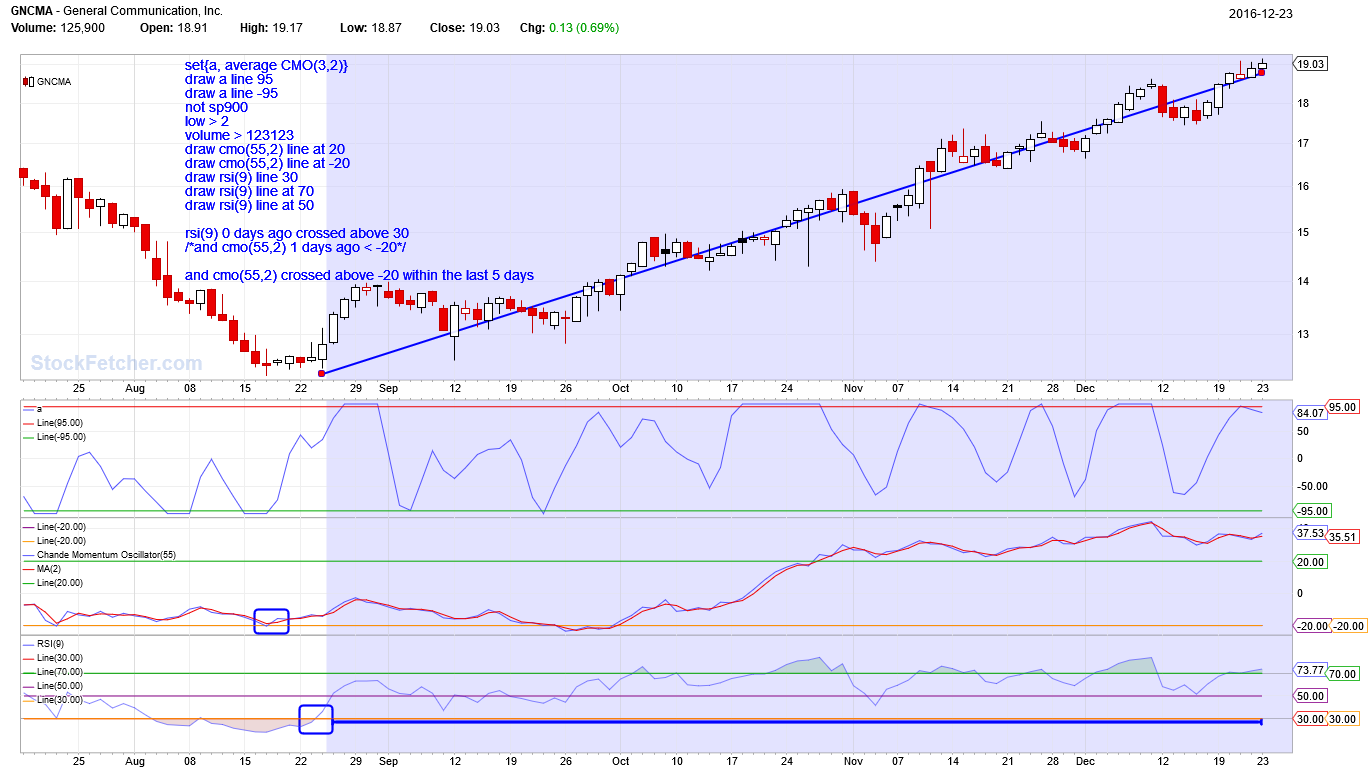 |
| four 5,087 posts msg #133377 - Remove message modified |
12/24/2016 8:46:18 AM 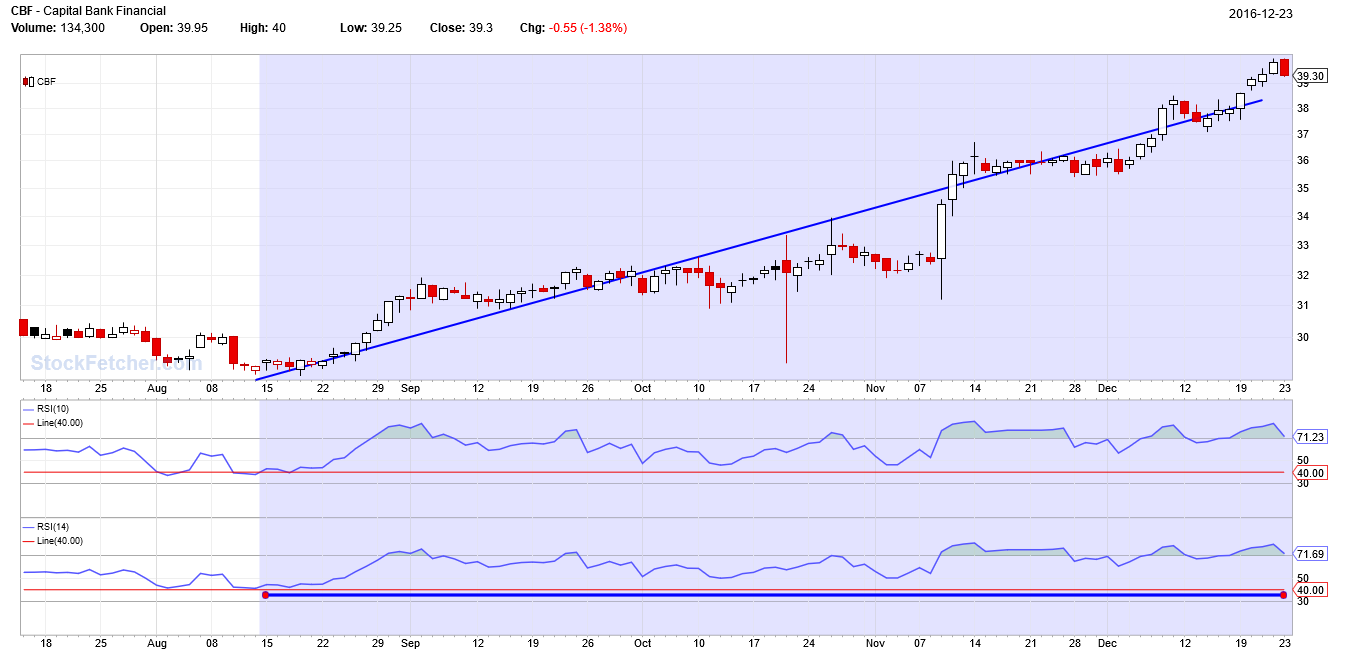 |
| four 5,087 posts msg #134396 - Remove message |
2/18/2017 1:50:59 PM |
| four 5,087 posts msg #135443 - Remove message |
4/15/2017 12:03:22 AM |
| StockFetcher Forums · Stock Picks and Trading · Generic2 | << 1 ... 3 4 5 6 7 ... 9 >>Post Follow-up |